
How do I know if I have a good retention rate?
Simple, you measure it properly. When I ask most founders or product marketers what their retention rate is their initial instinct is to talk about their monthly or daily active users (MAUs and DAUs). It’s great that they are tracking these metrics of course, but it’s pretty likely that these are not providing an accurate indication of true retention.

In a nut shell, a good retention rate is like the perfect length of string.
Why? It requires a clear frame of reference. The perfect length of string required to tie a bundle of sticks depends on it’s circumference. Similarly, the perfect retention rate of any product depends on how frequently it should be used. We can only answer both of these question once we have some context.
To help explain this further, let’s explore the fundamentals of retention.
The Fundamentals
 When it comes to web or mobile applications, a retained user is defined as someone who continues to exhibit a behaviour indicative of ongoing use, over time.
Let’s consider the familiar monthly active users (MAUs) retention metric to verify this framework.
To measure MAUs, the behaviour we are looking for is the act of ‘logging in’. The use over time window has been set to a ‘month’ (30 days). From this we get a group of users who we consider ‘retained’. We then divide the retained group (the numerator) by the total users (the denominator) to get our MAU retention rate. Huzzah, it works.
Retention Rate = retained users / total users
In the formula above, the retained user number is the result of the equation we previously worked out. However, if we include those values in the formula itself, it would look something like this:
Retention Rate = users who exhibit a certain behaviour over time / total users
Let’s push on. The key line here is: ‘exhibit a certain behaviour over time‘. If you can understand this, then you’ll understand what I like to call true retention.
True Retention

Put simply, true retention is the answer to the following question: ‘when the user last had problem ‘x’, did they use our product to solve it? Where problem ‘x’ is the problem your product solves of course (more on this later). Put even more simply, when the user needed to use our product, did they?
As you can see, there are still two parts to this equation. A behaviour, and a time period, yet they are being interpreted slightly differently. The behaviour remains true, it’s knowing whether a user ‘used the product’. However, the time period on the other hand is no longer a specific ‘time window’. Instead, it vaguely refers to the natural period of time it takes for a user to need to use the product.
True retention rate = users who used it when the needed it / total users
True retention is about measuring the completion of a behaviour within the time window that it should naturally take place. The time window is therefore defined as the interval between the user having the problem the first time, and the user having the problem a second time. This could be a short or long period of time.
Retention is About Measuring Problems
Every product solves a problem. Be it getting from A to B (Uber), finding information (Google), or booking accommodation (Airbnb). Our users encounter problems like these in their daily lives. The products we build are focused on solving these problems. The products capacity to do this is directly addressed through it’s core value proposition, more specifically, the primary utility of the product.
A products core utility is ultimately how it creates value, therefore, this is how we should measure retention.
With this in mind, it’s safe to say that our users only need our product when they are faced with the problem that our product solves. Retention is about measuring, surveying, or even guesstimating how frequently our customers are likely to face this problem in their daily lives. In other words, how frequently they need our product. This will be used as our ‘over time’ window for the retention formula.
Let’s use Airbnb as a case study to explore this further.
Airbnb Case Study
The MAU rate of Airbnb is… completely irrelevant. No one goes on holiday every month, so why measure ‘how many people booked accommodation in the past month’? Let’s try and define the true retention rate of Airbnb.
Firstly, we need to know the real rate of holidays that the average person takes each year. According to the ABTA, people take roughly 1.4 holidays per calendar year. We will treat this number as the global average as it sounds about right.
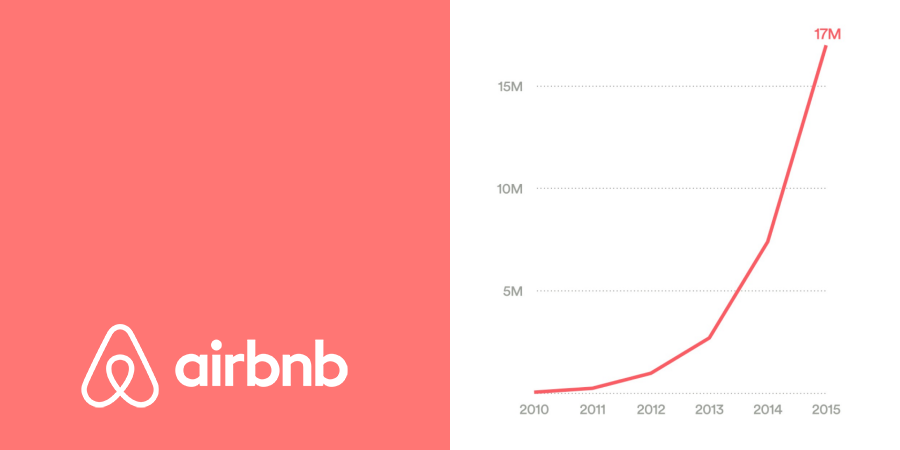
Next, we need to find Airbnb’s total user base so we can work out the total potential number of bookings that could be made. In September 2015, Airbnb has roughly 50 million total users. Let’s assume that by December it had grown to 60 million. Therefore 60 million people taking an average of 1.4 holidays per year would create 84 million trips.
Finally, we need to count the number of users who have ‘booked accommodation’ through Airbnb in the 2015 calendar year. Whilst Airbnb doesn’t reveal their actual bookings, they do reveal the number of nights stayed and average duration of stays. Using recently published Morgan Stanley statistics, we can guesstimate the total number of Airbnb bookings to be roughly 17 million in the 2015 calendar year.
So, we now have our two numbers. Firstly, the total number of accommodation bookings made by Airbnb users on Airbnb in 2015, 17 million. Secondly, the potential number of accommodation bookings made by Airbnb users on any platform in 2015, 84 million. Therefore, the true retention rate of Airbnb in 2015 can be calculated as follows:
17m Airbnb bookings / 84m potential bookings = 20%
The true retention rate of Airbnb is 20%. Moreover, one in five registered Airbnb users booked their 2015 holiday accommodation through Airbnb. Alternatively, four in five Airbnb users did not use Airbnb to book their holiday accommodation in 2015. This is assuming the data I’ve sourced is of course correct.
As you can see, the challenge with looking at the true retention window of Airbnb is that it would take one year for the data to be collected. This long propagation period is the primary reason why most companies look at MAUs. Ultimately, the true look back window may simply be too large. User retention is a long term game though.
More Examples
The key here is to be able to identify the normal usage pattern of your product. The following table provides further examples to help you identify this for your product.
| Product | True Retention (Behaviour/Time) | Natural Usage |
| Uber | Behaviour: booked a ride Time: in the past week. |
How frequently does the average person take a cab? Once per a week perhaps. |
| Xero | Behaviour: lodged BAS Time: in the last quarter. |
How frequently does a small business do their tax? Quarterly, lodging of BAS statements. |
| Slack | Behaviour: sent/read a message Time: in the past work week. |
How frequently are teams communicating? Weekly, Monday through Friday. |
| Ausmed | Behaviour: engaged in education Time: in the past month. |
How frequently does someone engage in education? Typically once per month. |
| Candy Crush | Behaviour: played game Time: in the past day/week. |
How often does someone get bored? Daily/weekly most likely. |
Final Thoughts
The main takeaway message of this article is to determine whether it’s necessary to track a true retention rate alongside your MAU or DAU rates. Some products will not require this. For some, like the last two in the table above, the natural consumption rate may be daily, weekly or monthly anyway. In these circumstances the conventional retention metrics are likely to offer accurate insights.
At Ausmed, we monitor MAUs quite closely. However, we also look at a 90 day retention window. This is because we know that the vast majority of our users undertake at least one educational activity every 90 days. If they have not used our service in the last 90 days, it’s highly likely they are no longer using the product. Therefore, we don’t consider them to be a retained user.
Finally, if you’re working on a product that naturally has long intervals between use, think Airbnb or an annual tax return software as an example, there are ways to reduce the time window. In situations like this, you could consider building features into the product that would encourage more regular use. For Airbnb this might be achieved by promoting local, short stay trips in the user’s home city. For tax return software, this could be achieved by encouraging users to add their tax-deductable expenses as they are incurred (all year round). In both cases, the time window being evaluated for retention would be significantly reduced.
This is amazing !
Very helpful advice in this particular post! It is the little changes that will make the largest change.
Many thanks for sharing!